

Reports
A great way to read and organize your data is the Reports feature. Learn more below.
In this article:
-
Distance travelled
-
Shock events
-
Trigger events
-
Humidity events
-
Health of devices
-
Utilization in total
-
Utilization by weekday
-
Utilization by weekend
-
Utilization for invoicing
-
Utilization by month
-
Utilization by daily usage
-
Tag connection status
-
Humidity over threshold
How do I use reports?
The Reports feature on the Derek Data Portal is a great way to view, analyze, and – in particular – share your data in a practical PDF document.
It scans the data from all the devices in a group (including its subgroups) based on the criteria of each report and a period of your choice to prepare a PDF for download that presents this data. The PDF report is automatically sent to the e-mail address for the user ordering. It normally only takes a few minutes to order a report depending on its size.
If you wish, you can also order reports on just a few selected devices from a list.
It is also possible to subscribe to reports. Define your report criteria and click subscribe. This will make the system generate reports automatically and send according to your preference whether you want daily, weekly, or monthly reports by mail on the data you are interested in.
You can create as many reports as you want.
Click Reports in any group to see your available selection of reports.
Important to keep in mind
The Reports tile is available from any group or subgroup. The group where you access the Reports feature will determine which devices is included in that report as data is taken from devices in that group including subgroups.
The maximum recommended number of devices in one report is 100.
If you want reports from a selected few devices only, click Select specific devices from group and subgroups under the headline Choose devices to include in report (press and hold CTRL to select several devices (Cmd for mac users).
You can also organize your devices into a subgroup and navigate here to order reports that include data from these devices only.

What is in a report?
Most of the reports follow a standard structure:
-
Frontpage – This specifies the report type, the group of devices, all specific report settings, and the time period covered in the report.
-
Table of devices – This will offer an overview of all the devices (name and serial number) that match the criteria you selected. Click each device name or scroll to find more specific results from this device.
-
Data readings or listings of data – The rest of the report will specify data from the individual devices based on the specific settings you requested. Click individual devices to go to the Derek Data Portal to inspect the data directly.
Important to keep in mind
If you want a report in a time frame close to your current date, be aware of the possibility that not all of your devices have transmitted data they have tracked in this period yet.
For the best and most accurate reports, make sure all the devices in a group have had a recent transmission before – and preferably close to – the end of the period you have chosen to include data from.
Sensor data reports
The first group of reports discussed in this article is based on various sensor data inputs.
We offer a short introduction to each report but encourage all users to try out for themselves which reports can help you with your business case – or maybe even offer you new exciting insights into your business.
Important to keep in mind
If you do not see a particular report on your report page which is described here, this is due to either the subscription and characteristics of your device or your user permissions.
Distance travelled
The Distance travelled report will analyze the position data from your devices to give you an estimate of how far these devices have travelled.
Starting from the GPS location of position 1, it will calculate the distance to position 2. This number will be added to the distance between positions 2 and 3, 3 and 4 and so on – all within your selected period.
This will not give you the precise and exact distance travelled of your assets, but it will offer you a clear indication as to which devices are being used and how much.

Important to keep in mind
Because the reported distance in the report is calculated between transmitted or logged positions only, it will be inaccurate for devices with low transmission frequency.
The reported distance should never replace a vehicle’s odometer.
Shock events
The Shock events report is a great way to get an overview of which devices in a group have tracked shock events above a certain limit.
Choose the minimum shock level that devices should have tracked in order to be included in the report and specify the period you are interested in.
The report will give you shock levels and locations along with map snippets of the individual locations for incidents.
Trigger events
The Trigger events report is a great way to get an overview of which trigger events have taken place on which devices – if any – in a specific period.
It makes all triggers available for selection and will mark all the devices that have tracked these events in the report.
Click the time stamp for any event marked in the list to inspect the circumstances of this event on map and in the data.


Important to keep in mind
Triggers for the various sensors should be activated in your device, either on LOG or TRANSMISSION, in order for the trigger events to be recorded and displayed in the report.
Humidity events
If you have RHTP devices in your group, an extra report will appear using the humidity sensor.
The Humidity events report will list all devices in the group that have tracked humidity events.
Specify the minimum humidity level in percentage that devices should have tracked in order to be included in the report and choose the period you are interested in.
Temperature events
The Temperature events report will list all temperature data over a certain threshold for all devices in the group.
Specify the minimum temperature level in Celcius or Fahrenheit that devices should have tracked in order to be included in the report and choose the period you are interested in.
Total time in motion
The Time in motion report uses the sensor in your device that tracks whether a device is moving or not to offer you a total time in motion .
It will add up all instances of movement down to every single second.
Depending on the asset you are tracking, this report will give you an idea roughly of how long something has been working for.
Choose a Utilization report for more specific and precise measurement of usage.


System and health reports
Reports can also be used as a tool to identify devices with states or characteristics that you need to react to – or can help you explain why data is not transmitting as expected.
Health of devices
The Health of devices report shows you the devices that might need to be modified or replaced.
First you select which characteristics you would like to see in the report, and then you select the date interval.
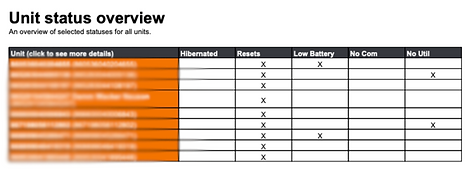
In the report, you will first get an overview of your devices where you can see whether they have been hibernated, reset, have low battery, have no communication signal, or have not been collecting any Utilization data in the selected period.
Then, for every device you will be given the relevant information.


Utilization reports
If your group includes devices on a Vision or Premium subscription with Utilization activated, a whole section of available Utilization reports will appear.
All reports marked with the clock icon use utilization data to visualize the use of your assets in various ways.

Utilization in total
The report provides you an overview of Utilization of all the devices in the group in a selected date interval.
It contains the following data:
-
Device count
-
Total utilization minutes
-
Average utilization minutes per device
-
Average minutes per device per day
-
Charts (idle/in use)
-
Devices with low utilization
Utilization by weekday
View Utilization by weekday for all devices in a selected date interval.
A graph is providing you with an overview of the usage hours of all your devices by weekday.
It also provides a list of alarm notification.


Utilization by weekend
View Utilization by weekday for all devices in a selected date interval.
A graph is providing you with an overview of the usage hours of all your devices by weekday.
It also provides a list of alarm notification.


Utilization for invoicing
This report gives your an overview of utilization for devices visualized in a practical way for invoicing and billing for rental companies and others.
In the period you specify, you will get an overview of
-
how long an asset has been working for
-
whether it has been working outside agreed working hours
-
whether it has been working on the weekend
So not only do you get an overview of how long your devices have been working in utilization minutes, but you also get figures for utilization outside agreed working hours – perfect for invoicing and documentation.
Create report for Invoicing overview
To make the report suit your workweek or a specific rental period, first you need to define when your weekend starts and stops as well as your daily working hours.
After this, you can either choose to create a report for a selected date interval or to create a report subscription.
Utilization by month
The Utilization by month report is a simple overview of the total lifetime utilization of the devices in your group.
The report gives you an overview of your group sorted by total utilization hours.
Click each device to see this total utilization organized in usage pr month and year.
Utilization by daily usage
With the Utilization by daily usage report, you can list devices that have tracked daily utilization that is higher than a defined number of minutes or hours in a period.
This gives you the option to identify which of your assets are being used more than a specific number of hours per day – and for how many days this has been the case in a period you specify.
Click to see the specific dates and the total utilization time for the day.
Tip: Set the daily usage limit for when to include devices in the report really low, such as 5 minutes. In this way, you will get a quick day-by-day overview of all devices in a selected date interval.


External tag reports
If your group includes devices that have Tags connected, a section of available Tag reports will appear.
All data in these reports are based on the data tracked by your external RHT tags.

Tag connection status
The Tag connection status report offers you in-depth information about devices in your group that have external RHT tags attached to them.
The report features a full list of devices with RHT tags in an overview that shows highest levels of RHT data from the last three transmissions along with battery information from both the external tag and the tracking device.
Click the name of the device for a comprehensive list including:
-
Device information
-
SIM
-
Subscription
-
Location
Humidity over threshold for tags
The Humidity over threshold report will list devices that have tracked humidity levels using RHT tags above a specific limit in a period.
Users can specify their own threshold(s) for humidity in percentage and all devices with Tags that have tracked humidity data above the threshold(s) will be listed in an overview.
Click the device name to see a graph of humidity within the period.
Users can also specify a number of Rolling average days. The report will calculate the average of humidity across this number of days leading up to the specified data points that are being displayed.
This will offer you a way to see how the humidity is trending. This data will be visualized as a curve on your graph.


Create report subscription
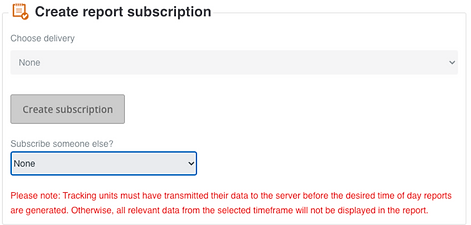
You can choose to create a subscription for every report. It will be sent to your e-mail address with your selected time interval.
You can choose the time of day you would like to receive the report, and if you prefer to get data from a specific time of the month.
You can also choose “between months”. This lets you specify which day of month you wish to get the report, and which days of a given month the report should cover.
You can quickly see which reports you subscribe to by the green color of the icons on the front page.
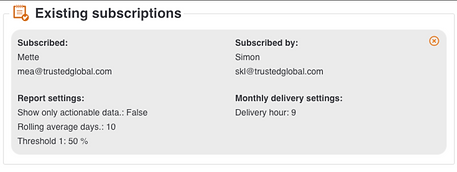
Click the reports to manage your subscriptions under Existing subscription.
Important to keep in mind
Again we would like to stress that for the best and most accurate reports, make sure all your devices have had a recent transmission before – and preferably close to – the last day of the period you have chosen to include data from.
If a device has not had the chance to transmit the data it has tracked, the report will be inaccurate. Furthermore, the contents of the same report could change later when all data is available.
If you, for example, want fresh data in a report on your desk Monday morning at 8, set up your devices to send a transmission on Sunday evening or Monday at 7 so the system will have all the latest data available before generating the report.


Create report subscription for other users
You can subscribe other users to reports if they have access to the same group as you are currently looking at.
Look for the user in question in the dropdown menu under “Subscribe someone else?”
